
Page 34 - 3D Metal Printing Spring 2018
P. 34
3D Q&A
100 95 90 85
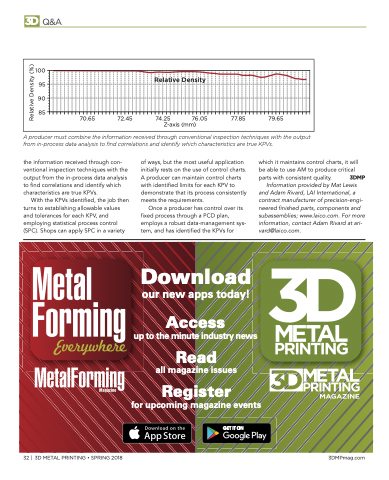
Relative Density
74.25 76.05 Z-axis (mm)
Relative Density (%)
the information received through con- ventional inspection techniques with the output from the in-process data analysis to find correlations and identify which characteristics are true KPVs.
With the KPVs identified, the job then turns to establishing allowable values and tolerances for each KPV, and employing statistical process control (SPC). Shops can apply SPC in a variety
of ways, but the most useful application initially rests on the use of control charts. A producer can maintain control charts with identified limits for each KPV to demonstrate that its process consistently meets the requirements.
Once a producer has control over its fixed process through a PCD plan, employs a robust data-management sys- tem, and has identified the KPVs for
Download
our new apps today!
Access
up to the minute industry news
Read
all magazine issues
Register
for upcoming magazine events
32 | 3D METAL PRINTING • SPRING 2018
3DMPmag.com
70.65 72.45
77.85 79.65
A producer must combine the information received through conventional inspection techniques with the output from in-process data analysis to find correlations and identify which characteristics are true KPVs.
which it maintains control charts, it will be able to use AM to produce critical parts with consistent quality. 3DMP
Information provided by Mat Lewis and Adam Rivard, LAI International, a contract manufacturer of precision-engi- neered finished parts, components and subassemblies; www.laico.com. For more information, contact Adam Rivard at ari- vard@laico.com.
